
Viewing Execution Statistics
Displays duration, records processed, records failed, operation type, and action for every Map and entity processed by the Solution execution. On the Execution History page or the Execution History section of the Solution Edit page select an execution of a Solution. From the Gear menu ![]() select View Statistics to open the View Statistics dialog. Maps are listed in the order in which they run. Refer to the Fields table below for field definitions.
select View Statistics to open the View Statistics dialog. Maps are listed in the order in which they run. Refer to the Fields table below for field definitions.
Note: If a Solution executes and no records are processed, the associated Maps do not display in View Statistics.
The Duration column is not displayed for Replication Solutions.
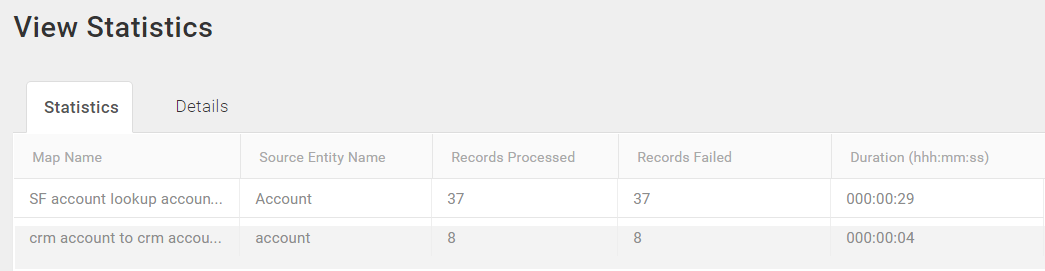
Execution History: View Statistics — Statistics Tab
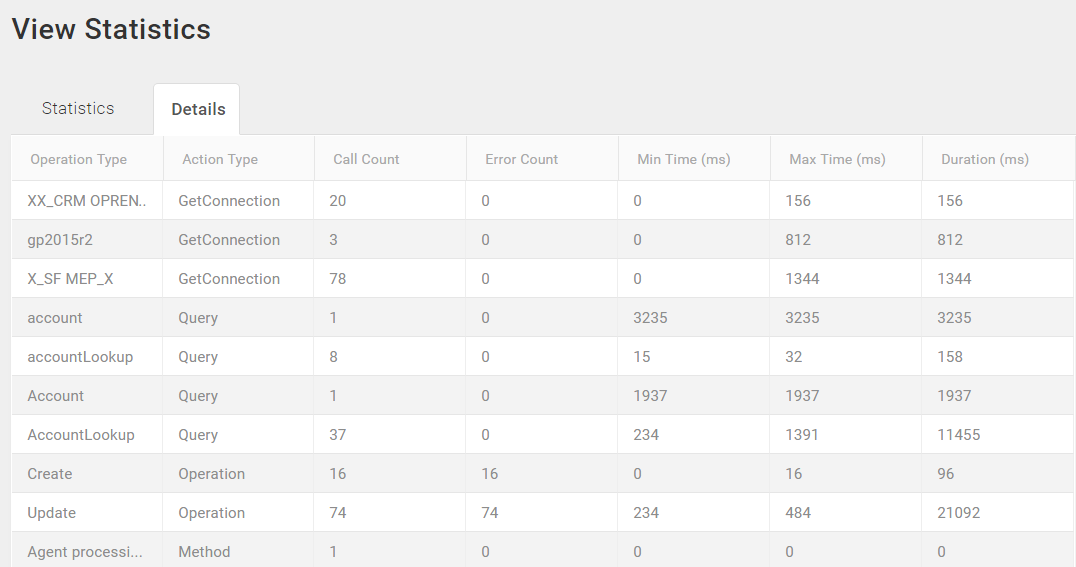
Execution History: View Statistics — Details Tab
Fields
For each Map and entity processed by TIBCO Scribe® Online, the View Statistics dialog displays the following information:
| Field | Definition |
|---|---|
|
Statistics Tab |
|
|
Map Name |
Name of this Map. If the Solution includes multiple Maps, statistics display for all enabled Maps. Applies only to Integration and Migration Solutions. |
|
Source Entity Name |
Name of this source entity. If the Solution includes multiple entities, this tab lists the statistics for each entity in the run on a separate line. |
|
Records Processed |
Total number of records processed for this entity. |
|
Records Failed |
Number of records that failed for this entity. |
|
Duration |
Length of time it took for this entity to run. The combined durations for each entity may not equal the duration for the entire Solution run. |
|
Details Tab |
|
|
Operation Type |
Object for which statistics are gathered, including: Connections, Entities, Agent Processing, or Operations. |
|
Action Type |
Action performed on the object specified in the Operation Type column. For example, for a Connection, the Action Type is GetConnection. Types include: • GetConnection — Opens the Connection to the datastore. • Method — Used with Agent processing. • Operation — Operation executed on an entity, such as Create or Update. • Query — Requests entity data. |
|
Call Count |
Number times a call was made to the object specified in the Operation Type column. |
|
Error Count |
Number of Method, GetConnection, or Operation errors. |
|
Min Time (ms) |
Shortest time in milliseconds used to process either a single call or record in a Map. |
|
Max Time (ms) |
Longest time in milliseconds used process either a single call or record in a Map. |
|
Duration (ms) |
Total time in milliseconds to process all calls in the Call Count field. The total Duration is the sum of all of the actions and equals the duration of the execution. |
Related Topics
Viewing Execution History Details
Managing Failed IS, Event, Or MS Execution History Records