
Debugging Maps
Use the Debug tool on the Map workspace to execute a Map and watch the results to locate logic and record errors. Execute the Map either, Block by Block, in series of Blocks based on the location of breakpoints that you specify, or enable the Break On Record Error option to execute Blocks in sequence until a record error is found. See Debug Errors for more information.
Unlike the Preview feature, Debug mode executes the selected Map using the specified Connections. Debug modifies your target data, and the execution results display in your Execution History. When breakpoints are added to the Map the debug process moves from one breakpoint to the next across multiple Blocks instead of executing the Map one Block at a time. Best practice is to only use Debug Mode in a test environment.
Tip: Debug follows the logic and flow of your Map as though it were executing normally. For example, for If/Else Blocks, Debug processes the If/Else logic and then correctly processes either the Block following the If or the Block following Else. For more information, see If/Else Block.
Note: Best practices is not to modify a Map while in Debug Mode. The Map is loaded in the Debug session when you enable Debug Mode and any changes to the Map are not reflected in Debug results. To include Map changes in Debug results, exit Debug Mode, modify and save the Map, and return to Debug Mode.
Debugging Maps is not supported if your Map:
- Is Incomplete.
- Is Disabled.
- Is Running
- Is Preparing
Requirements
To start Debug Mode for a Map:
- The Map must be enabled on the Maps list for the Solution.
- The Agent you selected for this Solution must be running.
- There must be no errors in the Errors And Warnings tab of the workspace or any individual Blocks. See Block And Map Errors And Warnings for more information.
- Changes to the Map must be saved. Select Apply before starting Debug Mode.
When you select Apply, the Map revision is saved and the Preparing process readies the Map to run. During the Preparing process the Debug Mode link and the Start link are disabled for a few moments until the process is complete.
Note: When you select Debug Mode, the Connection panel on the left is hidden and the Properties panel on the right is replaced with a set of Tabs that display information during the Debug process.
Debug Commands
To display Debug commands, open the Map to debug and select Debug Mode. To end Debug Mode, select Exit Debug Mode or Stop.

- Start — Start processing this Map in Debug Mode. Debug processes the first (Query) Block then stops.
Note: When you start Debug, the Solution begins to run; you cannot make changes to the Map, no other users can use this Solution, and the Status on the Solutions page displays as In Progress.
- Continue — Continue restarts the debug process. Debug runs until the next breakpoint is hit, if Break On Record Error is enabled it runs until a record error is found, or until the end of the Map is reached.
- Stop — Stop Debug Mode. When you select Stop, the Solution becomes available. The Status on the Solutions page displays as Last run failed.
- Next — Process the next Block in this Map.
- Break On Record Error — If enabled, the Debug process stops running when it reaches a record error and displays an arrow at the appropriate location. An error dialog displays and the error also displays in the right pane on the Errors tab. See Debug Errors.
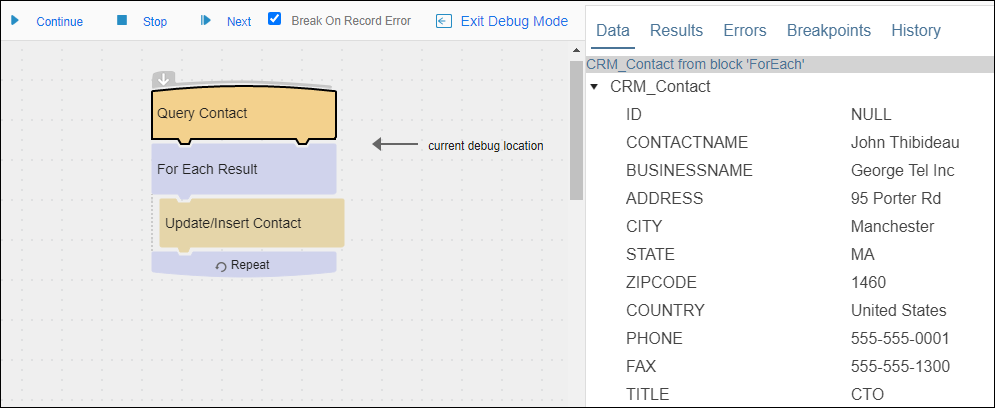
Debug Tabs
Debug tabs display information about the records being processed based on the Blocks in the Map above and below the Debug arrow. Tabs include:
Notes
- Debug sessions time out after 10 minutes of being idle. The warning is shown briefly and then is closed. If a Debug session times out because it has been left open for more than 10 minutes, the next time you start a Debug session, nothing happens and you must start the Debug session again.
- You can edit a Map while in Debug Mode, but the changes are not reflected in Debug results. To include Map changes in Debug results, exit Debug Mode, save the Map, and return to Debug Mode.
- Depending on the Map type, Debug processes the Map as follows:
- Integration Maps — Debug begins with values from the first source record found and processes all records in order. You can also select a history record and use that data to debug your Map.
Note: If an Integration Solution is scheduled to run while you are in Debug mode, the Solution does not start until you stop Debug mode.
- Event Message Maps — Debug queries your source and uses the values for the first record found. However, if your Outbound Message excludes some fields, the data used in Debug differs from your actual Map. Only one record is processed. You cannot set Breakpoints on the Wait For Message Block. Conditional Breakpoints are not supported. For more information, see Defining An Event Message Map.
- Event Request/Reply Maps — Debug processes the Map using the values from the Sample Value column of the Wait For Request Block. Only one record is processed. You cannot set Breakpoints on the Wait For Request Block. Conditional Breakpoints are not supported. You can, if needed, reset the sample values.
- Integration Maps — Debug begins with values from the first source record found and processes all records in order. You can also select a history record and use that data to debug your Map.
- When running in Debug mode, other users see the Status for this Solution as In Progress.
- Batch processing is deactivated in Debug. Debug always processes one record at a time, even if batch processing is enabled for some Blocks.
- Debug does not update the Net Change date value for the most recent record processed for the Map.
- Dates are shown in their raw format as returned from the datastore.